E-commerce : Essential KPIs to maximize your success
All indicators are green. This is the good news from Fevad, which published the e-commerce report for the year 2022.
The total e-commerce turnover (products and services combined) was 146.9 billion euros in 2022, an increase of 13.8% year-on-year. All e-merchants are actors in this growth. And to support it in the best way in 2023, 2024, and the following years, one step is crucial: to follow and measure its performance, thanks to essential KPIs.
In e-commerce, 11 key KPIs should be followed carefully. Do you know them? Do you know why they are important? And how does Rakuten France help you to follow them, to maximize your growth? All the answers are in this article.
What is a Key Performance Indicator (KPI)?
A Key Performance Indicator (or KPI) is a particularly important numerical data in e-commerce. It is a quantitative measure, which allows measuring the performance of your online store. By tracking different KPIs, you assess the achievement of your important objectives.
So, are you making efficient progress? Do your strategic decisions allow you to achieve significant results? What are the outcomes of your marketing and commercial actions, particularly in terms of ROI?
To answer all these questions, it is necessary to define and measure performance indicators. In e-commerce, there are several types of KPIs to follow, to measure the performance of your online sales site. Ready to discover 11 reference indicators?
The 11 different types of KPIs to measure in e-commerce
1. Turnover
This is one of the most important KPIs. Do you know your turnover (sales) generated by selling your products online? This turnover (excluding and including taxes) is calculated by adding up all the revenues generated by sales.
For regular monitoring of this indicator, calculate your turnover weekly, monthly, then annually. Group these amounts in a dashboard to track the evolution of your sales. By regularly analyzing your turnover, you carefully assess the health of your business!
2. Cost of Purchase
Before selling your products, you had to buy them (or create them). This purchase cost fluctuates throughout the year, depending on raw materials, economic context, etc. It is also referred to as the cost of goods sold. It is important to follow it, to optimize your commercialization prices and maximize your growth!
By tracking this KPI, you make the right commercial decisions to optimize your margins... And this is precisely the 3rd crucial KPI, to strengthen your performance: the commercial margin.
3. Commercial Margin
The commercial margin corresponds to the difference between your final selling price and your initial purchase cost. It's a key element of good profitability! To make a profit, it is recommended to achieve a margin of 50%.
In e-commerce, the commercial margin generally starts at 30%. The larger this margin, the more profitable your online store is. This indicator also helps you define the most appropriate selling price.
4. Number of Orders
Do you know how many online orders you have completed? Daily, weekly, monthly, yearly? This indicator is valuable: it allows you to realize the number of baskets validated and paid for by your customers, over a given period. The goal is to compare the evolution of the number of orders, depending on the seasonality of e-retail.
Note: the number of orders does not correspond to the number of products sold. Turnover also does not give the number of orders made. This separate indicator must be followed diligently, while correlating it with the number of products sold and the average basket.
5. Number of Products Sold
This KPI allows you to observe the number of items purchased on average per order placed. Indeed, your consumers may buy one product at a time, or 3, or 10... What is the trend that emerges from their e-commerce buying behaviors?
Beyond tracking this KPI per order, also think about analyzing this indicator globally (the total number of products sold over a given period).
6. Cart Abandonment Rate
The cart abandonment rate measures the percentage of customers who add one or more items to their cart without finalizing their purchase. To calculate it, it is necessary to divide the number of orders placed by the number of abandoned carts, and multiply by 100.
The average cart abandonment rate is between 60 and 70% for an e-commerce site. It's a rather common situation, which also concerns physical commerce: not all visitors who enter a store necessarily buy products.
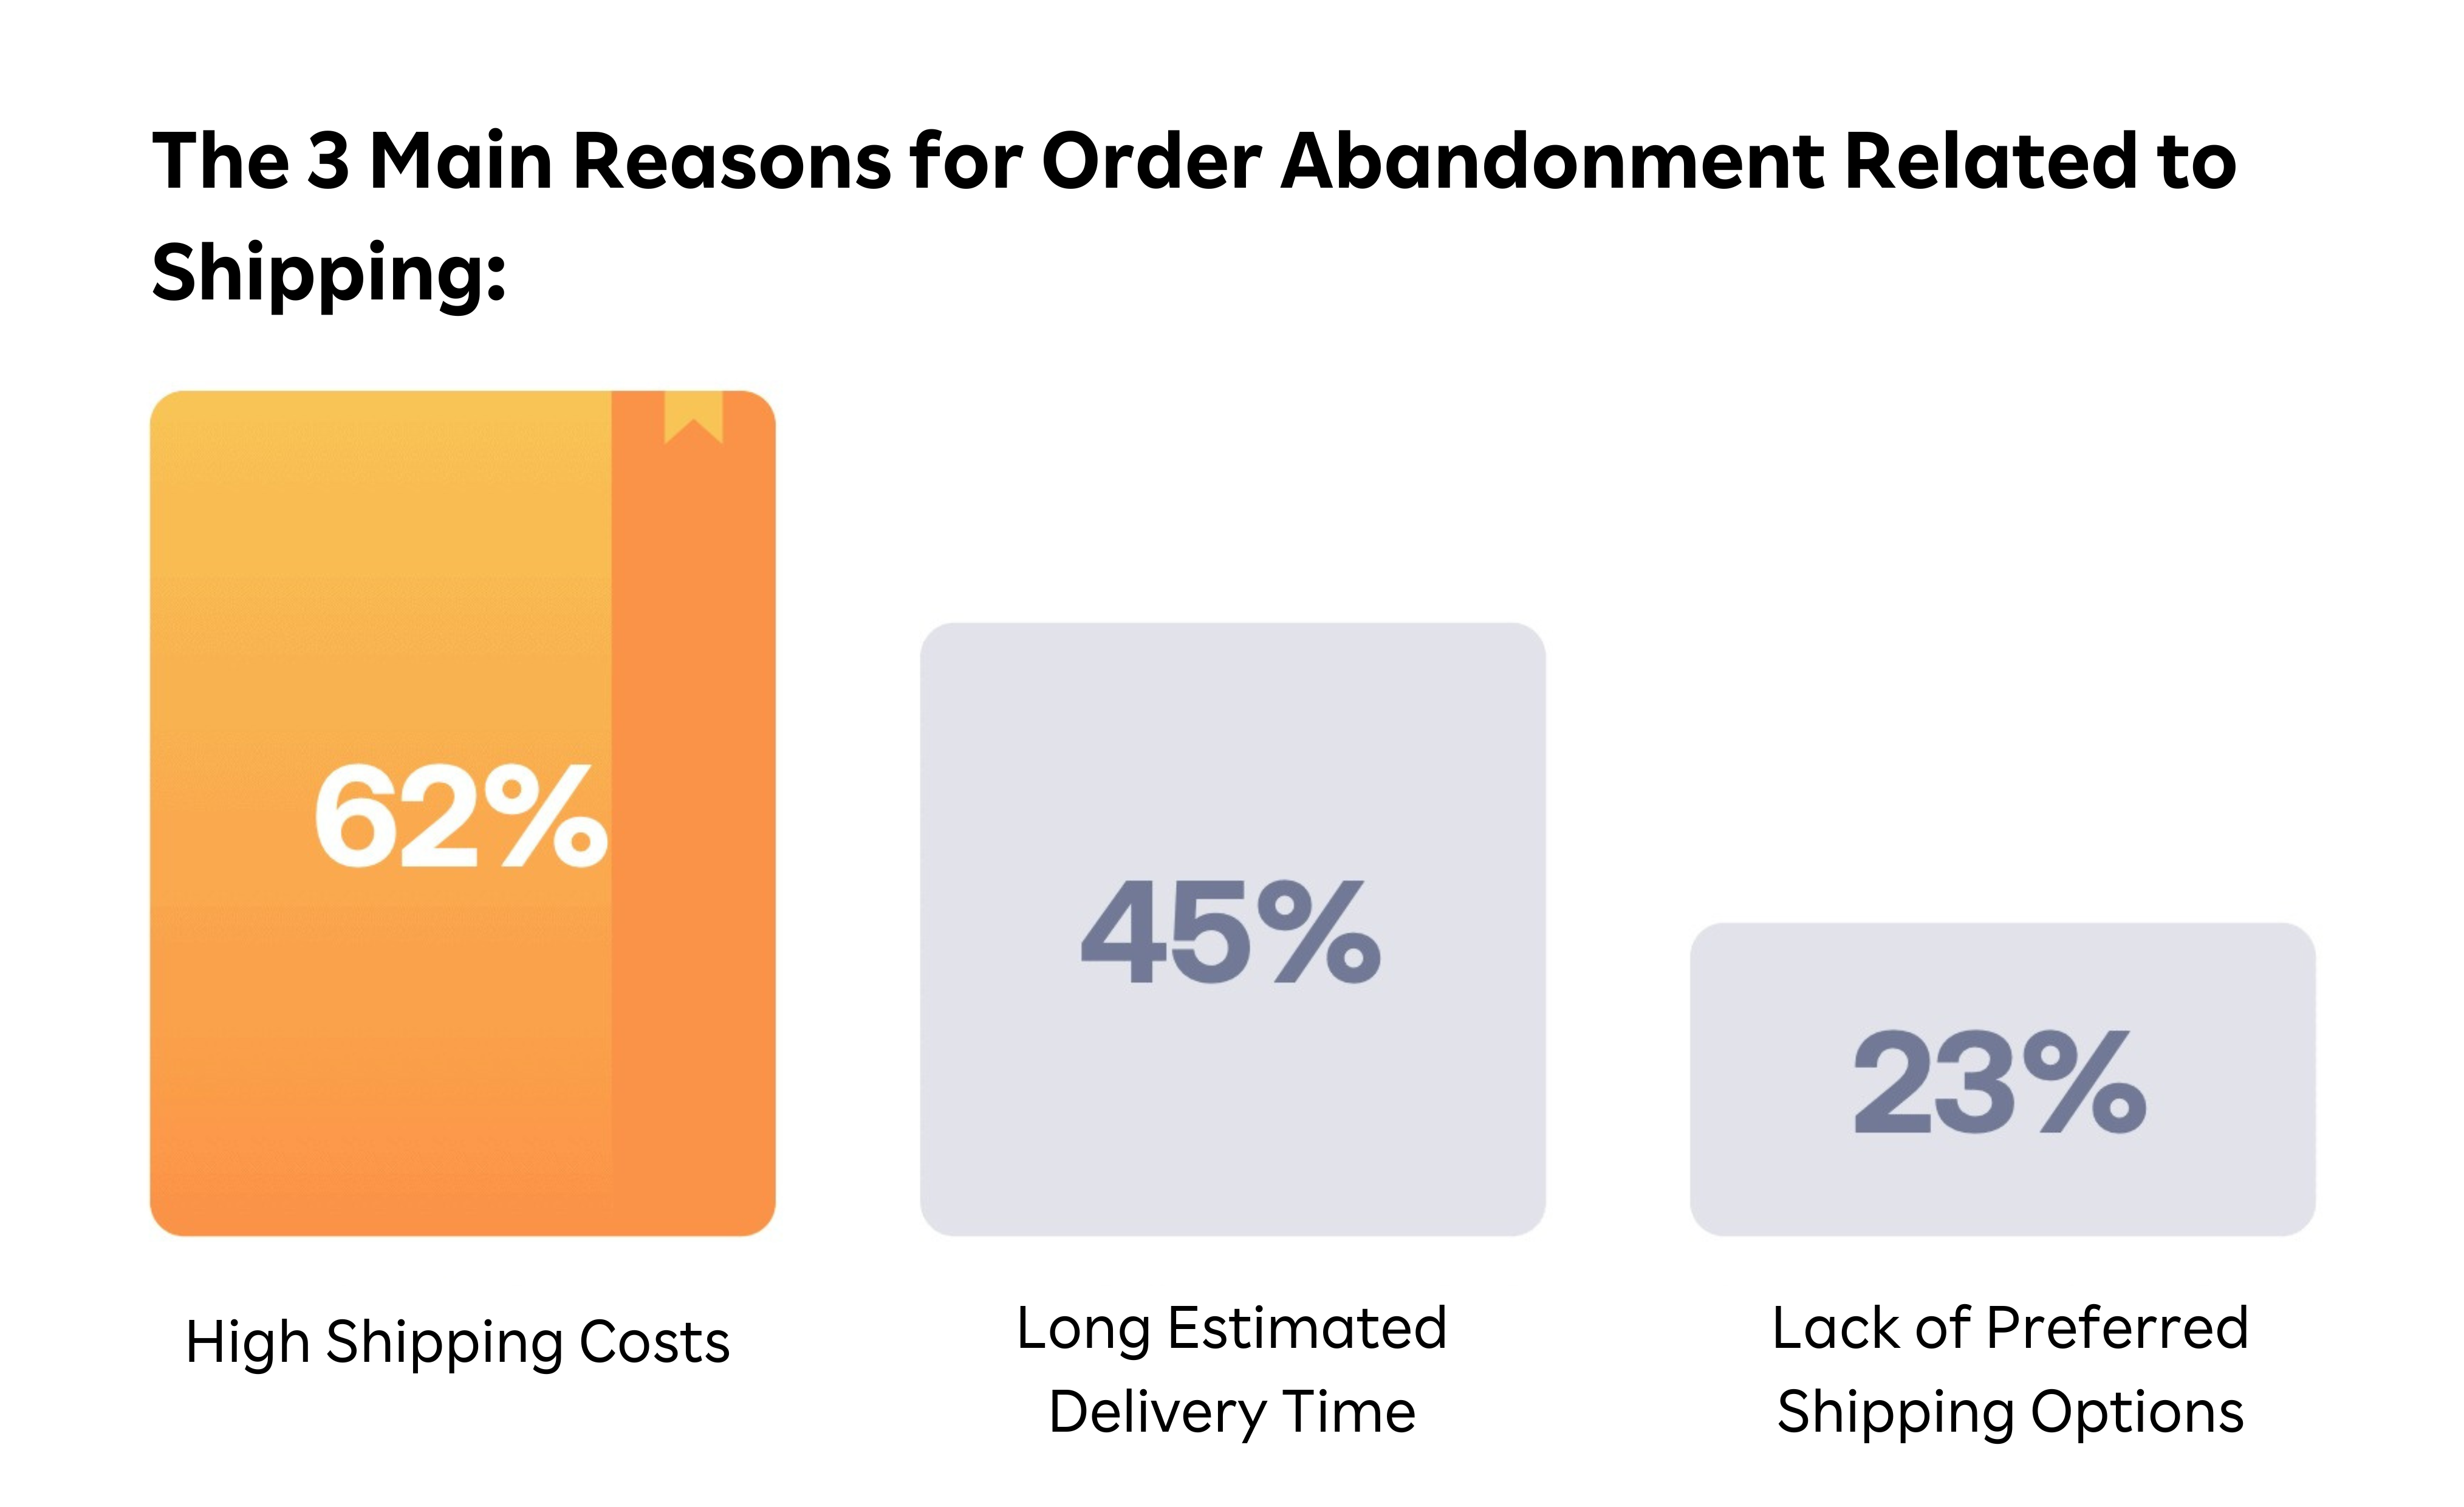
This KPI allows you to realize the number of visits that did not result in conversion, and to identify why. Too complex purchasing or payment process, high delivery costs, difficult returns and refunds... These are the main reasons.
 Source of the graph : Étude Sendcloud, 2023
1. Expanding Reach with Rakuten France
Rakuten France offers the opportunity to reach new customers. Over 12 million, to be exact. Indeed, our marketplace is frequented by a large consumer base ready to purchase. For you, this means a continuous flow of customers who already trust the marketplace and the e-shops on it.
By integrating this digital marketplace into your strategy, you automatically track the number of sales and conversions generated from our marketplace. Tracking these data will allow you to assess the impact of Rakuten on your overall revenue and adjust your efforts accordingly. Everything is accessible 24/7 from the dashboard of our solution.
2. Conversion Rate Analysis on Rakuten France
Each marketplace platform has its own audience and buying behavior. From our all-in-one tool, you can monitor the specific conversion rate for Rakuten France, to understand the performance of your products on our platform.
By adjusting your strategy based on these data, you can optimize your product listings and maximize your conversions on Rakuten France. And again, everything is accessible in a few clicks.
3. Inventory and Delivery Management
Integrating your e-shop on Rakuten France often involves managing your inventory and delivery processes. With Rakuten Fulfillment Network, you can reduce your logistical costs with a fixed rate, while delegating packaging, delivery, and order tracking.
However, even if you delegate, you can still closely follow the KPIs related to delivery times, returns, and the availability of your products. To strengthen your reputation and retain your customers on our marketplace, focus on maintaining a quality customer experience.
4. Integration Cost and Return on Investment (ROI)
Integrating Rakuten France may involve initial costs and ongoing fees, depending on the chosen subscription. Your mission (should you choose to accept it) is to track the cost of this integration against the benefits generated on the platform. This will give you a better visibility of your ROI.
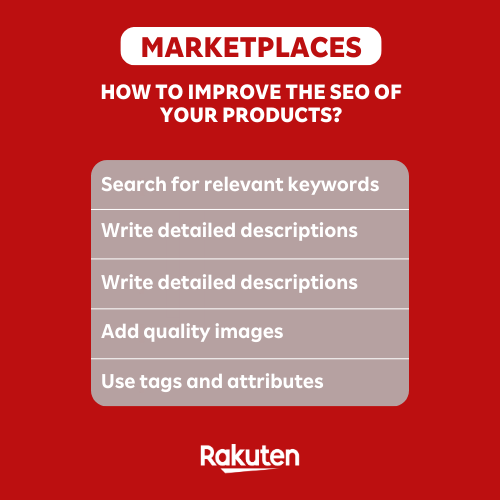
With these indicators, you can then make informed decisions to increase visibility on the marketplace, and thus enhance your performance. For example, have you considered improving the SEO of your products, to reach more customers… And thereby generate more revenue, which will offset the cost of integrating the marketplace?
Conclusion: Marketplace or E-commerce, Which Decision to Make?

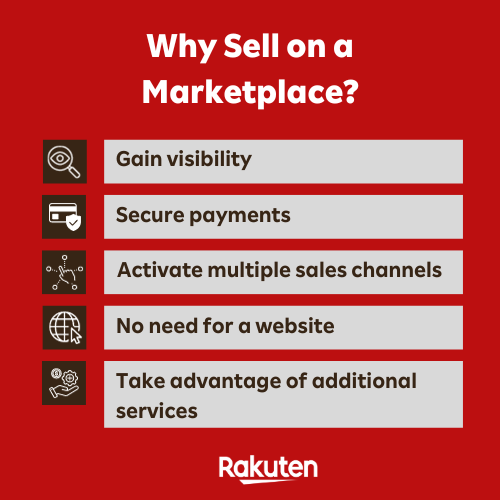
In 2020, marketplaces recorded a growth of 81%, which is twice that of e-commerce (Mirakl, 2021). Since then, the enthusiasm for digital marketplaces has continued. For e-commerce merchants integrating a marketplace, the savings in time and money are very real.
But whether your choice is to create an e-commerce store or integrate a marketplace, there's a habit you need to develop: tracking your performance indicators. On these two online sales channels, it's an essential approach. To ensure the success of your business, you now know the three letters to follow, which will help you at every stage of your development: KPI !
