Sales Seasonality: Anticipating Sales Peaks and Calculating Your Seasonal Index
Do your sales fluctuate from month to month? Nothing could be more normal. All businesses experience sales peaks and troughs at certain times of the year. This is known as sales seasonality.
Whether you sell physical products or services, whether you operate solely on e-commerce or have your own store: you're affected by the concept of sales seasonality. Weather, vacations, commercial highlights... many parameters affect your sales strategy.
How can you anticipate these peaks in demand by calculating your seasonal coefficient? How can you maximize growth opportunities, thanks to sales seasonality? Find out all the answers in this article.
I. Understanding Sales Seasonality
What is sales seasonality? Definition
Sales seasonality is an event that occurs several times a year. It refers to the fluctuation in demand for a product or service throughout the year. When a company experiences this intense increase in sales activity, it is referred to as a "sales peak".
All companies are affected by these cycles, which impact on their marketing and sales performance. There are many factors influencing sales seasonality:
- Seasons & weather;
- Vacations;
- Cultural events;
- Annual French or foreign festivities;
- Commercial highlights (sales, Black Friday, etc);
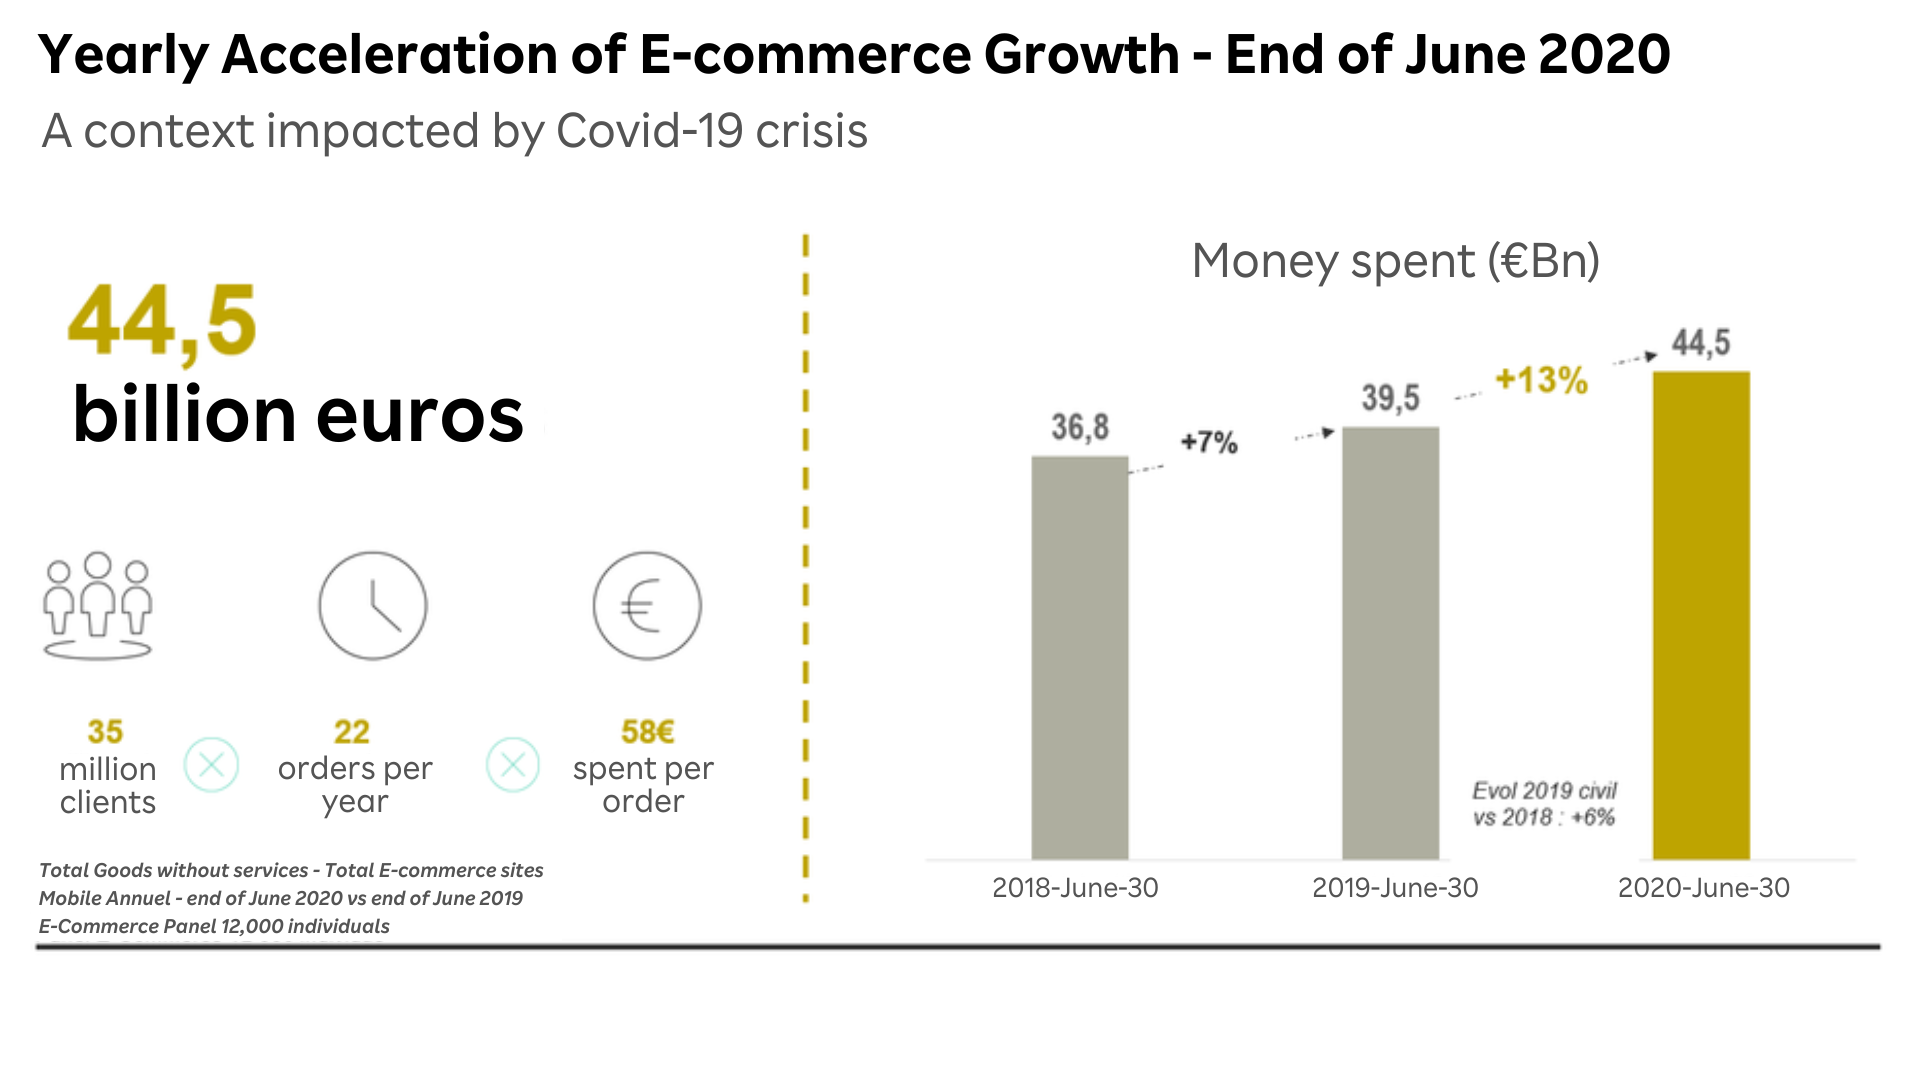
Some events are unforeseen, such as natural disasters or the Covid-19 crisis, which disrupted sales of certain products: hygiene and cleaning products, essential items... Meanwhile, e-commerce spending increased by 13% during the health crisis.

Source: Kantar e-commerce barometer
In addition, other events can be anticipated to maximize business growth during these peaks. Ready to explore some examples?
Some examples of sales seasonality
Certain major events or business dates dictate sales seasonality. For brands, it's essential to be aware of them, so as to capitalize on these periods.
By anticipating these key dates and trends, it's easier to anticipate sales forecasts... And to increase sales, market share and growth. All the while, making informed business and marketing decisions to effectively support this growth. For example, in the event of a sales peak, have you considered the strategies to be implemented to increase the average basket?
In an increasingly competitive business environment, this strategy is essential! Here are a few examples of sales seasonality, to give you a better idea of the concept:
- For florists, the two biggest sales holidays are Valentine's Day and Mother's Day. Every year, these professionals can generate up to 30% of their sales on a single day!
- In the outdoor hotel market (such as campsites), 85% of bookings are concentrated in the 6 weeks of summer.
- As soon as spring arrives, garden products are in demand. The milder weather invites customers to spend more. Amour Buidine (Sales Manager at ManoMano.fr) told Le Figaro: "16% of sales in this segment are made in April, compared with 3% to 4% between November and February. The same applies to the Internet: we triple our sales of swimming pools and other landscaping products from the first to the second quarter".
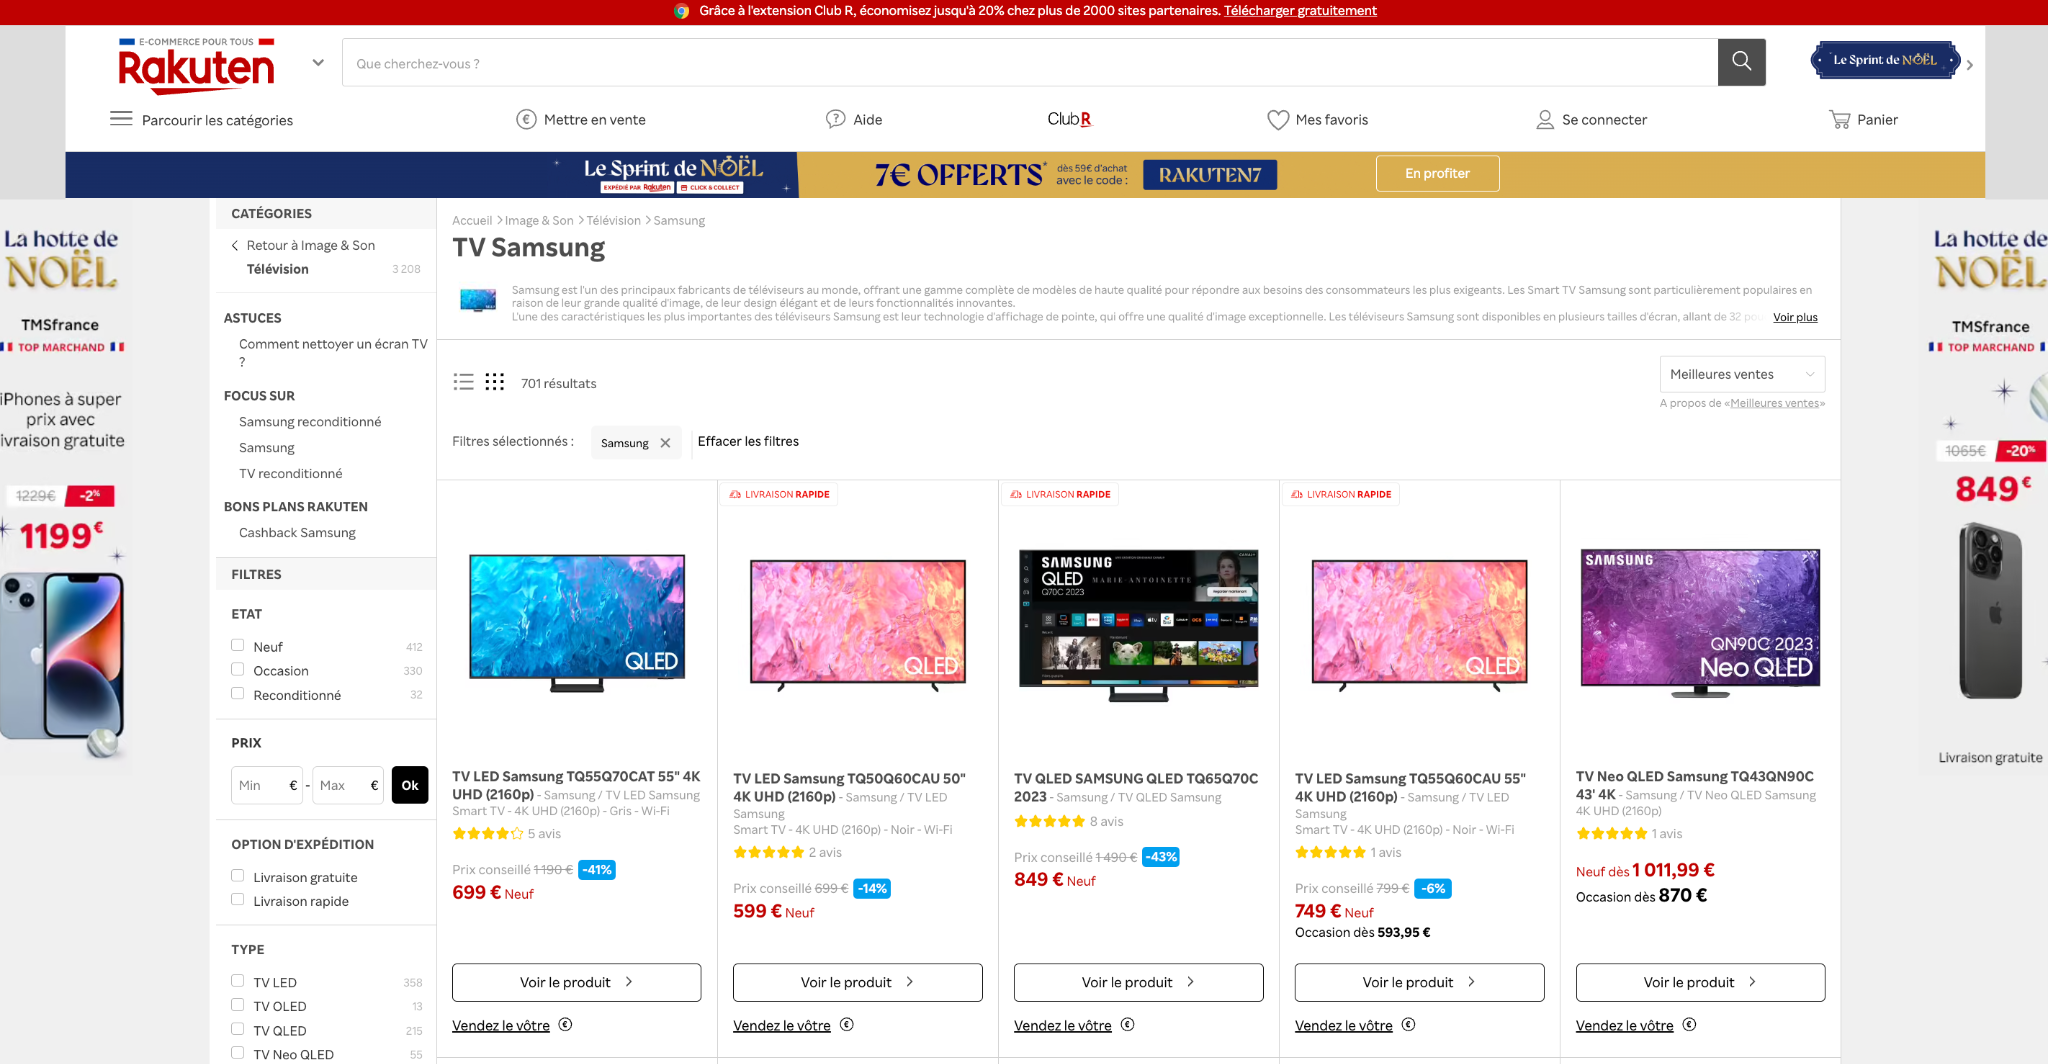
- During the soccer World Cup, the market for TV sets increases dramatically. This was notably the case in 2022, for the World Cup in Qatar. Guillaume Rault (vice-president of Samsung Electronics) confided in a Challenges interview : "There was an upturn in September in terms of quantity. In October, this was reinforced by an increase in market value. We're seeing double-digit increases. Some weeks are 28% or 35% up on last year. The World Cup should enable the TV market to sell 250 to 300,000 more pieces!"

You've guessed it: sales seasonality affects every brand on the market, at different times of the year, and according to different criteria of influence. The challenge for brands? To anticipate sales peaks, in order to better manage their supply chain, as well as their marketing and sales strategy.
II. How to anticipate sales peaks?
To identify trends in your market and anticipate sales peaks, here are 3 best practices:
1. Analyze your historical data
Have you tracked and measured your key performance indicators (KPIs)? If you've already launched your business (such as an e-commerce site), it's essential to examine the past, in order to prepare for the future.
So, do you know what your monthly sales are? What are the seasonal trends? How do the average consumer basket, number of orders and conversion rate evolve over the months? All this quantitative data will help you better understand and anticipate sales peaks.
2. Identify local, seasonal and national events
Do you want to prepare for seasonal sales trends? Think about listing all the events that may affect your company, or the market in which you operate. More commonly referred to as a "chestnut", these are the key dates of the year that can influence your marketing and sales strategy.
For example, they could be sales periods, school vacations, sporting events, trade fairs, national celebrations... Position them on an internally shared calendar, so that all teams are aware of them. From the marketing department to product managers and sales staff.
3. Adapt your inventory and human resources
Finally, after analyzing your historical data and identifying future key calendar dates, here's our last tip: adapt your merchandise inventories, as well as your human resources. When demand peaks, your priority is to satisfy your customers. To achieve this, avoid stock-outs. Having the right quantity of goods in stock is a matter of preparation, several weeks (or even months) before the busiest periods.
Then, to deliver a memorable customer experience, don't underestimate the human factor: do you have the necessary in-house team to cope with the rush? In store as in e-retail, anticipate recruitment to guarantee a smooth customer experience.
III. Calculate the seasonal coefficient
To obtain the most accurate sales forecasts possible during seasonal peaks, we need to monitor a specific indicator: the seasonal coefficient.
The seasonal coefficient is a numerical indicator that can be calculated on a weekly, monthly or quarterly basis. It represents the ratio between the actual performance of a product or service during a specific period and its average performance over a longer period.
Its calculation highlights the potential of one period (compared to another) for the sale of a product. Thanks to the seasonal coefficient, you can define whether or not a moment can be considered "seasonal" for your consumer sales.
Here are 3 situations in which it's a good idea to calculate the seasonal coefficient, along with the appropriate formula:
1. Analyze the seasonality of the year's sales
The seasonal coefficient helps you identify the weight of sales during a given period in your company's annual sales. Thanks to its calculation, you can anticipate the marketing actions to be deployed at the next sales peak... And evaluate the effectiveness of the previous action plan put in place.
Here's how it works:
Sales for the month (or defined period) / total sales for the year
Let's take the example of a bicycle accessories e-commerce site. In 2023, the company sold €30,000 worth of products, including €6,700 in January 2023 (corresponding to the winter sales).
Seasonal coefficient = 6,700 / 30,000
Seasonal coefficient = 0.223
January 2023 therefore has a seasonal coefficient of 0.223. This is always rounded to 3 decimal places.
2. Compare seasonality with previous years
Let's go back to the previous example. Now, the e-commerce site selling bicycle accessories wants to know its seasonal coefficient in relation to the two previous years, and track its evolution.
Step 1: calculate average annual sales over the last two years.
22,000 (in 2021) 27,000 (in 2022) = €49,000
49 000 / 2 = 24 500 €
Average annual sales are €24,500.
Step 2: Calculate average monthly sales over the last two years.
4,800 (in January 2021) €5,500 (in January 2022) = €10,300
10 300 / 2 = 5 150 €
Average monthly sales are €5,150.
Step 3: calculate seasonal coefficients for each month
To do this, let's take the average monthly sales figure and divide by the average annual sales figure
5 150 / 24 500 = 0,210
The average seasonal coefficient over the previous two years is 0.210 in January. If we compare this with the seasonal coefficient for January 2023, we see a clear increase in sales, and therefore growth. A good sign for the company's performance!
3. Calculate future sales forecasts
The seasonal coefficient is the ally of forecasting. It also provides an accurate forecast for the coming year. From the monthly coefficients calculated, you can determine the sales forecast for the months of the coming year.
Let's return to our previous example. To calculate sales for January 2024, the calculation is as follows:
Sales for 2023 x seasonal coefficient for January 2023
30 000 x 0,223 = 6 690 €
Forecast sales for January 2024 will therefore be €6,690.
This calculation is based on a linear sales forecast. But be careful! Other parameters may influence seasonal forecasts upwards or downwards.
Our advice? Once you've made your calculations, always compare actual monthly and annual performance with your estimated forecasts. These analyses will enable you to adjust your marketing, stocking and human resources strategy accordingly.
And if you need a helping hand to refine your forecasts and boost your sales performance... Rakuten France is at your side. Here's how.
IV. Rakuten France: your ally in seasonality management
Yes, sales seasonality is an evolving trend, for all players in the retail industry. But here's one thing that never changes: our presence alongside marketplace sellers throughout the seasons. Over 12,000 professional sellers are active on our marketplace. To help them win over our 12 million customers, here's what we're doing:
- Analytical tools: from their dashboard, Rakuten France sellers benefit from advanced analysis tools. Thanks to these tools, they can visualize and understand all their sales data. The ease of use of the analysis tools means that seasonal trends can be identified at a glance... Perfect for adjusting your sales strategy!
- Targeted marketing strategy: from Rakuten France, you can set up targeted marketing campaigns for consumers, based on identified sales peaks. Is there a season when your e-shop needs to boost sales? Maximize your visibility to customers by following our recommendations.
- Inventory management: this is a priority for all e-tailers aiming for growth. To make this easier, you can integrate data from your Rakuten France e-shop into your inventory management system. This makes planning more precise. Ideal for anticipating your next sales peaks.
Now you know how to understand sales seasonality, calculate your seasonal coefficient and anticipate future peaks. Our final piece of advice? Don't wait for the next acceleration period to make the best decisions! Join our marketplace and effectively develop your online business!